From an excellent post here , we have a clear explanation of how to make custom colormaps. Under matplotlib there is a colors module which has a method called LinearSegmentedColormap that can create a colormap for your use.
First you need to make a color dictionary which looks like this:
The triple (0.7, 0.0, 0.5) for instance, means for 'green' when the normalized value is just below 0.7 the green component should be 0.0, and just above 0.7 the green component should be 0.5. This of course creates a discontinuity in the map at 0.7. To make a continuous map all the pivot points should have the same value above and below. So the triple (0.5, 0.25, 0.25) for 'red' means for values just above and below .5 the 'red' component will be .25 .
Values in between pivot points are linearly interpolated by the function matplotlib.colors.LinearSegmentedColormap.
A complete (and ugly) example is given below:
First you need to make a color dictionary which looks like this:
cdict = {
'red'  :  ((0., 0., 0.), (0.5, 0.25, 0.25), (1., 1., 1.)),
'green':  ((0., 1., 1.), (0.7, 0.0, 0.5), (1., 1., 1.)),
'blue' :  ((0., 1., 1.), (0.5, 0.0, 0.0), (1., 1., 1.))
}
For each 'primary' additive color (rgb) you have to specify a tuple (...) which inturn is a collection of triples. Each triple defines a pivot point for that color in your color map.The triple (0.7, 0.0, 0.5) for instance, means for 'green' when the normalized value is just below 0.7 the green component should be 0.0, and just above 0.7 the green component should be 0.5. This of course creates a discontinuity in the map at 0.7. To make a continuous map all the pivot points should have the same value above and below. So the triple (0.5, 0.25, 0.25) for 'red' means for values just above and below .5 the 'red' component will be .25 .
Values in between pivot points are linearly interpolated by the function matplotlib.colors.LinearSegmentedColormap.
A complete (and ugly) example is given below:

import pylab as mThe api is more for reference, rather than learning.
cdict = {
'red' : ((0., 0., 0.), (0.5, 0.25, 0.25), (1., 1., 1.)),
'green': ((0., 1., 1.), (0.7, 0.0, 0.5), (1., 1., 1.)),
'blue' : ((0., 1., 1.), (0.5, 0.0, 0.0), (1., 1., 1.))
}
#generate the colormap with 1024 interpolated values
my_cmap = m.matplotlib.colors.LinearSegmentedColormap('my_colormap', cdict, 1024)
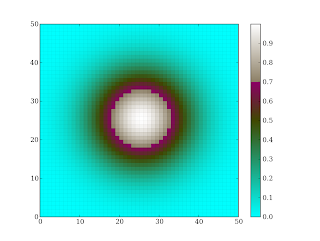
#create a gaussian
x = m.arange(0, 50 , 1 , m.Float)
y = x[:,m.NewAxis]
x0 = y0 = x.size // 2
fwhm= x0/1.2
z = m.exp(-4*m.log(2)*((x-x0)**2+(y-y0)**2)/fwhm**2)
pcolormesh(z, cmap = my_cmap)
colorbar()
Thank you very much...you have very clearly explained what I was struggling to learn from terser sources.
ReplyDeletePaul